Professors Duncan Bassett and Graham Williams are Endocrinologists at Imperial College London and Consultant Physicians at the Hammersmith Hospital specialising in Metabolic Bone Disease and Thyroid Disease respectively. They are also the Principal Investigators in the Molecular Endocrinology Laboratory in the Department of Medicine at Imperial College London.
Their current research focuses on the molecular basis of bone and cartilage disease (www.boneandcartilage.com). These studies have identified new genetic determinants of bone mass and strength. In addition, they have a longstanding interest in thyroid hormone action and the role of thyroid hormone in both skeletal development and the maintenance of adult bone. These studies have clarified the complex relationship between central and peripheral thyroid status and identified a critical role for local thyroid hormone metabolism in bone.
Back scattered electron scanning electron microscopy (BSE-SEM) imaging is used in both the bone and joint phenotyping platforms. The goal of the research is to identify genetic determinants of bone and cartilage disorders. Describing his choice of detector, Professor Bassett said “We have used the Deben detector on our collaborators microscope for more than 10 years. When we purchased our own TESCAN SEM last year, we wanted to continue to use the best BSE detector available. We particularly like the large detector size with its four quadrant configuration. This delivers an excellent signal to noise ratio.”
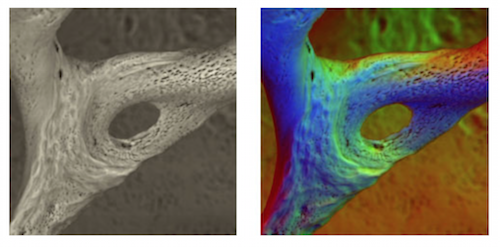
Performance of the detector is illustrated in these two images which show an example of a trabecular bone. The left hand BSE-SEM image shows osteoclast resorption and osteocyte lacunae in trabecular bone. The intricate and delicate network of canals that connect the osteocyte lacunae can also be seen as black holes and dark lines on the bone surface. On the right, in this version of the image, data from three individual quadrants are coloured red, green and blue and combined to enhance appreciation of topographical information.

You should hear from us shortly.

